Chi-square tests are hypothesis tests designed to let us assess hypotheses related to categorical variables. Of interest to us for this course are the chi-square tests looking at hypotheses relating to two categorical variables.
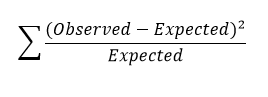
For chi square tests in this course, we will have observed counts (frequencies) of observations in the different combinations of levels from the two categorical variables, and we want to see if those counts are consistent with the null hypothesis. Working from the null hypothesis, we can determine what expected counts we would see if the null hypothesis was true. Then, we want to look at the difference between the observed and expected counts. Due to some mathematical issues, we can’t work with just the differences. Instead, we square the differences, rescale by the expected counts, and then add up all those deviations. The formula for the test statistic is therefore:
For these tests, you will be learning to compute the test statistic and look up the P-value in Excel directly.
Chi-square Test of Heterogeneity
We are considering whether counts within specific categories are similar across (at least) two groups. In short, one of the categorical variables is being used to specify groups, and we examine the distribution of the other variable across those groups.
For this test:
HO: There is no difference in the percentage of observations in each category for the first variable with respect to the second variable (the groups).
HA: There is a difference in the percentage of observations in each category of categories for the first variable with respect to the second variable (the groups).
The null hypothesis could also be expressed as: the percentage of observations of the first variable is the same for all populations.
For example, suppose we were examining ice cream preference (vanilla, chocolate, or other) among first, second, and third graders. The grade level variable is categorical with three levels and denotes the groups (populations). Ice cream preference is the other categorical variable, and also has three levels. So, we would be looking to see if:
HO: There is no difference in the percentage of observations in each category of ice cream preference with respect to the grade level. OR The percentage of observations in each category of ice cream preference is the same for all grade levels.
HA: There is a difference in the percentage of observations in each category of ice cream preference with respect to the grade level. OR The percentage of observations in each category of ice cream preference is not the same for all grade levels.
Now let’s take a look at some examples in biology.
Example 1 (Gall lab)
Perhaps you are interested in whether there is a difference in the frequency of gall attacks by birds in different years. In one year the winter was very cold, so you anticipate higher bird predation than another year in which winter temperatures were average.
For this test:
HO: Predation by birds does not differ across types of winter.
HA: Predation by birds does differ across types of winter.
Excel directions
Video Directions:
R directions
Data File
Example 2 (Stream Lab)
Horvath et al. (1999) were interested in determining whether the composition of stream macroinvertebrates would vary in response to the presence of zebra mussels, an invasive species that causes economic damage and has negative impacts on ecosystems (Fuller 2017). In contrast to the detrimental effects that zebra mussels have on other species, they create a surface that macroinvertebrates may adhere to and have been found to increase abundance of some types of macroinvertebrates (Wisenden and Bailey 1995). We will use a subset of data from Horvath et al. (1999).
HO: There is no difference in the percentage of observations in each category of macroinvertebrates in the presence of zebra mussels versus the absence of zebra mussels.
HA: There is a difference in the percentage of observations in each category of macroinvertebrates in the presence of zebra mussels versus the absence of zebra mussels.
Excel directions
R directions
Data File
Example 3 (Corn Cob Genetics)
Here, you are given a sample of corn grown locally in Massachusetts. Your goal is to consider patterns of inheritance. First, you observe phenotypic frequencies of traits you are interested in (color, sweetness, etc.) in the F2 generation. With these frequencies, you would like to determine if these individuals are the offspring of a monohybrid or dihybrid cross. In this example, you think that the corn you observed is the result of a dihybrid cross.
HO: There is no difference between the observed phenotypic frequencies and those expected from a Mendelian dihybrid cross.
HA: There is a difference between the observed phenotypic frequencies and those expected from a Mendelian dihybrid cross.
Excel directions
Literature Cited
Fuller, P. 2017. NAS – Nonindigenous Aquatic Species: Dreissena polymorpha. USGS.
Horvath, T. G., K. M. Martin, and G. A. Lamberti. 1999. Effect of Zebra Mussels, Dreissena polymorpha, on Macroinvertebrates in a Lake-OutletStream. The American Midland Naturalist 142:340-347.
Wisenden, P. A., and R. C. Bailey. 1995. Development of macroinvertebrate community structure as- sociated with zebra mussel (Dreissena polymorpha) colonization of artificial substrates. Canadian Journal of Zoology 73:1438-1443.