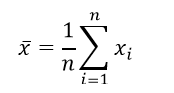
In this class, we will use the arithmetic mean (sample mean) as the central tendency for most labs. The arithmetic mean is probably already familiar to you. To calculate it, you simply add up each of the observed values for your variable in the data set (1 to n) and then divide by the number of values you gathered for that variable (the sample size, n). We let each observed value have notation where i is an index taking values from 1 to n. The formula for the arithmetic mean is given by:
How to think about the arithmetic (sample) mean:
In a histogram of your variable, the sample mean is the balancing point for the distribution. It is an equally weighted average of all the observed values of your variable. It is fairly easy to explain the concept of the mean, so we see it reported often as a preferred measure of central tendency. Be aware though, that the mean can be sensitive to extreme values in the distribution of interest, so there are times that statisticians would recommend you use other measures of central tendency.
Example
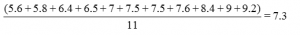
For females in the example above, we compute the sample mean as:
We can perform the same function in Excel using the *average* function. You want your variable values all in the same column (or row) in order to use this command as demonstrated below.

Excel
Mean:
=AVERAGE(startingcell:endingcell)