The median is another measure of central tendency that is often used when the mean may not be an appropriate summary measure. The median is simply the middle number in the sorted list of observed values for the variable. By taking the middle observed value, extreme values at the edges of the distribution do not have a great impact on our measure of center. When considering the median, the idea is that 50% of observed values for the variable fall at or below that value, and 50% fall at or above that value.
To calculate the median, you must first sort your observations by their value. In Excel, when the variable is in a column, this puts the smallest value at the top and largest at the bottom. Then, you need to extract the middle number. If you have an odd number of observations, the middle value is the median (Take the variable value in the (n+1)/2 position in the sorted list). If you have an even number of observations, you will find the mean of the middle two values (the values at the n/2 and (n/2)+1 positions), and report that as the median.
Example
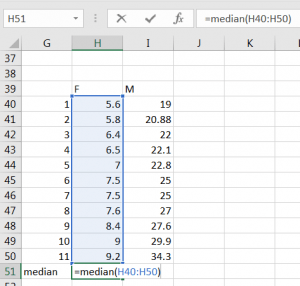
In our female fiddler crab example, we find the sorted list of values to be:
List: 5.6, 5.8, 6.4, 6.5, 7, 7.5, 7.5, 7.6, 8.4, 9, 9.2
We note that there are 11 values, so n=11. n+1 This is an odd number so we find (n+1)/2=12/2=6. We need the 6th value in the sorted list. Working from the list, we find that the median is 7.5.
![]()
Excel
=Median(cell:cell)