Measures of central tendency and measures of variation allow us to consider the central point in the data as well as variability around that point. Furthermore, we learned we can also talk about variability in our statistics (you can talk about their centers too!). Generating a confidence interval combines these two methods of describing the data – we get a single statistic to estimate our quantity of interest (parameter of interest), but since we know the statistic varies from sample to sample we incorporate that information about spread to obtain an interval of values that are reasonable values for the population parameter.
Let us consider this in the context of our female fiddler crab example. Suppose you want to know what the average claw size of female fiddler crabs. You gathered data, and from that, we learned the sample mean is 7.32 (roughly). This is our best guess of the population mean largest claw size.
However, we also know that the sample mean will vary from sample to sample, and we can estimate that variability. So, we can give a better sense of where the population mean may be if we incorporate that information. A confidence interval does exactly that. When working to get a confidence interval for a population mean, it uses the standard error of the sample mean and a theoretically derived piece (a multiplier) combined with the sample mean (as the starting value) to give you a range of values that are reasonable for the population mean.
For this example, with a sample mean of 7.32, sample standard deviation of 1.21, sample size of 11, and significance level alpha of 0.05, we find what is called a 95% confidence interval for the population mean size of the largest claw for female fiddler crabs to be:
![]()
So, we find, based on our data that reasonable values for the population mean are from 6.51 to 8.13 mm, with 95% confidence. The 0.81 is called the margin of error and that is used to create the error bars in scientific graphs. Think of the margin of error as showing the uncertainty around the statistic. The general structure of the confidence interval is to take the statistic plus and minus the margin of error to create the interval.
A Quick Note on Alpha and Confidence Levels
To generate a confidence interval, you need to set the level of confidence. There is a relationship between the confidence level and significance levels we discussed for hypothesis tests. Without going into major detail, the idea is to understand we can never be 100% confident – random sampling means that we may have obtained a sample that is a poor representation of the population. That’s unlikely, but it could happen. So, we use our understanding of statistics to talk about our results using a high level of confidence, which influences which theoretical multiplier is used in the creation of the confidence interval. The level you set is typically discussed as a percentage between 0 and 100% (usually 90% or higher). This level can be “mapped” to a corresponding significance level. In particular, a 95% confidence level maps to a 0.05 significance level for a two-sided hypothesis test. A 90% confidence level maps to a 0.10 significance level for a two-sided hypothesis test. So, if you have a significance level in mind, use that and you will be generating a (1-significance level)*100% confidence interval. The confidence level gives us control over the long-run proportion of generated confidence intervals (in the same situation) that we expect to contain the true parameter of interest.
Don’t worry too much about understanding this, just know that you need to set an alpha (significance level) to generate a confidence interval in Excel, and it is basically setting the confidence level.
Example
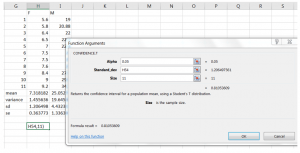
To calculate a confidence interval for a population mean in Excel, there are a few steps. Note that the function here actually computes the margin of error for you. You’d have to take steps after that to generate an actual interval if you wanted one.
- Use Confidence.T to calculate the margin of error.
2. If you are graphing the CI, you are done and can use this value for the lower and upper error bars. However, if you want the actual value of the low and high limits of the CI, take the mean minus the number you obtained to find the lower limit of your confidence interval and the mean plus the number you obtained to find the upper limit of your confidence interval.
Confidence Intervals for Other Parameters
In this section we have focused on the confidence interval for a single population mean. You can create confidence intervals to obtain ranges of reasonable values for a multitude of other parameters – a single population proportion, a difference in population means of independent groups, etc. In each case their basic construction is the same, but slightly different mathematical formulas are used to do the computation.