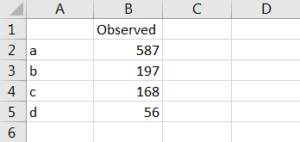
- Enter the values you observed for each phenotype
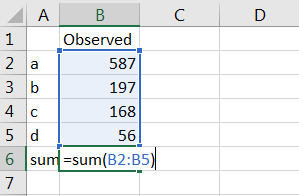
2. Calculate the total number of observed individuals. Enter =sum(cell:cell).
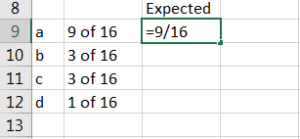
3. Record your expected ratios for each phenotype into Excel. Type =value/value for excel to calculate the ratio.
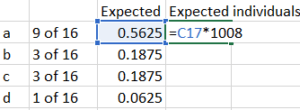
4. Calculate the expected number of individuals of each phenotype by multiplying the total number of individuals (here 1008) by the expected ratio.
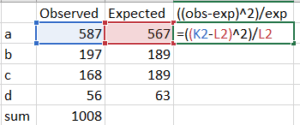
5. Calculate observed values minus expected values and square this difference. Divide the squared difference by the expected values Use =((cell-cell)^2)/cell.
6. To find the chi-square value, add all values in the column (obs-exp)^2)/exp. Use =sum(cell:cell). 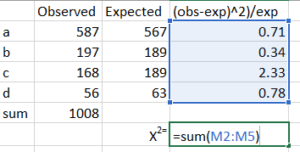
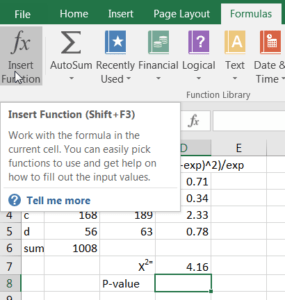
7. Now, go to the Formulas tab and select Insert Function.
8. Select the CHISQ.TEST option.

9. Highlight your observed column for the “Actual_Range” and your expected column for “Expected_Range”. Click OK.
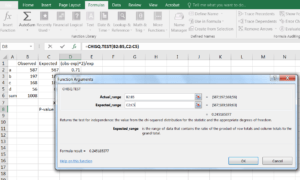
10. Now, you should have both a χ2 statistic and a P-value for your test.
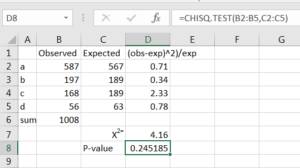
In this case, you fail to reject the null hypothesis because your P-value exceeds your cutoff (alpha=0.05). Thus, your phenotypes do not differ from the expected frequencies under a Mendelian di-hybrid cross (χ2=4.16, P=0.245).