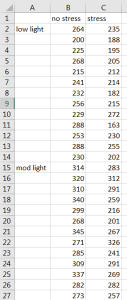
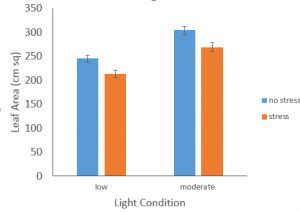
- Enter the data, with one factor as columns and the other factor in rows. Graph your data.
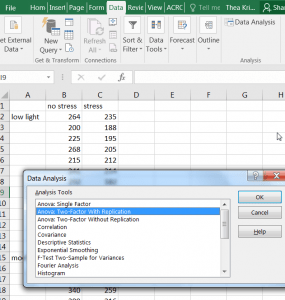
2. Go to the Data tab at the top and select Data Analysis Toolpak. Then select Two-way ANOVA with replication and click OK. Again, replication just means there are multiple observations at each combination of factor levels.
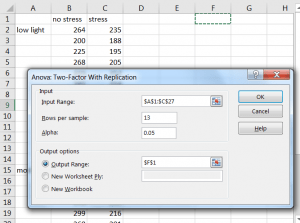
3. Select your data including the labels and type in the number of rows (here 13) per level of the factor listed in rows. Click in the box beside output range to type in where you would like your output or select a new worksheet. Click OK.
4. You will have quite a bit of output for this test. There is a summary table for each level of the factor from the rows, which includes separate columns for each of the levels of stress. The Totals listed to the right are totals for the light levels (without inclusion of stress) and the totals listed at the bottom are totals for the stress levels (without inclusion of light). For our purposes, you are most interested in the F-statistics and P-values in the ANOVA table. There will be several F-statistic-P-value pairs – one pair for each factor variable, and one pair for the interaction term.
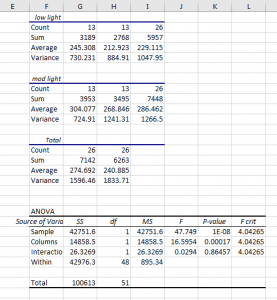
5. Looking at the ANOVA table, you can determine the statistic and level of significance for the interaction and each of the factors you tested. First, always look at the interaction row for its F statistic and P-value. We see F=0.03, P=0.86. Therefore, there was no significant effect of the interaction of the light level and stress on the leaf area of these soybeans. We check the interaction first because it would impact our discussion of the main effects for the two factor variables.
With the interaction found to be insignificant, we can check the main effects for the two factors by looking at their corresponding F statistics and P-values. Sample corresponds to your rows, which in this case are your levels of light. There was a relationship between light and leaf area (F=47.7, P<0.001). Columns here refer to stress. There was an influence of stress (F=16.6, P<0.001).
When you take statistics, you can learn about post-hoc multiple comparison tests to determine where differences arise. Here because there are only two levels of each factor, and in general, for our purposes, you can take a look at your averages by group. So for light, the average leaf area at low light was 229.1 cm2 and at moderate light was 286.5 cm2, thus we would suggest that with increased light, the soybean plants had larger leaf area, on average. Without stress, average leaf area was 274.7 cm2 whereas under stress conditions, it was 240.9 cm2, so soybeans had larger leaf area when they were not exposed to stress, on average.