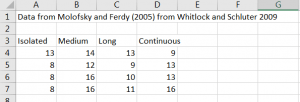
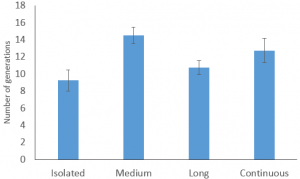
- Enter data into Excel, with groups in columns. Graph your data.
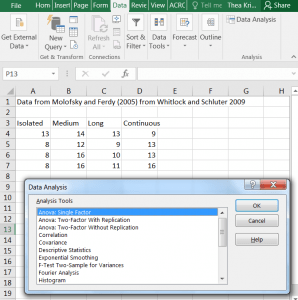
2. Select the Data Analysis tool from the Data Tab. Then select One-way ANOVA and click OK.
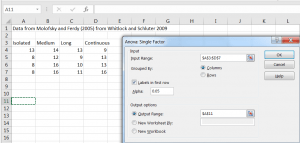
3. Select the data, including the column headers that you would like to use in this analysis. Make sure to indicate that it is grouped by column. Then select “Labels in first row”. Click in the box to indicate where you would like the output placed within the page or select new worksheet if you would prefer it to show up on a different worksheet. Click OK.
4. You will obtain the following tables. The Summary table indicated the count (how many observations in the group), the sum (of values in that group), the average or mean of values in that group and the variance of values in that group. The results for your test show up in the ANOVA table. The ANOVA table is an artifact from how hand computations used to be done for this test. It was useful though, so the results are still presented in this format. The F-value is the test statistic you are interested in and the P-value allows you to determine whether your result is significant or not.
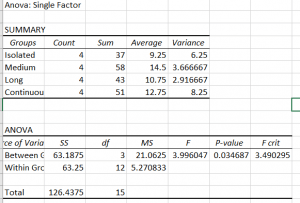
5. The F-value is 3.996 and P-value is 0.035. Therefore, in your text, you would say: There was a significant difference in the mean number of generations persisted by C. pensylvanica by isolation distance (F=3.996, P=0.035).