To understand more about the concept of interaction, we present a series of examples in a generic setting. We have two factor variables A and B. A has 2 levels, and B has 3 levels. The response variable is continuous. We will look at a plot called an interaction plot to help our understanding of the concept of interaction. An interaction plot simply plots the mean of the response at each combination of factor levels and then connects the means with a line. Here, with 2 levels for A and 3 levels of B, 6 points are plotted, and then connected with a line.
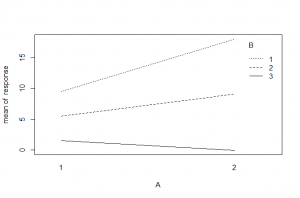
This first example has NO interaction between the factors. We can look at the mean values of the response. When A is at level 1, the levels of B have mean responses about 1 unit apart (2-3-4). When A is at level 2, the levels of B STILL have mean responses about 1 unit apart (3-4-5). The shift up can be attributed to the shift from A level 1 to A level 2. In other words, the effect observed based on the level of B is consistent across the levels of factor A.
Let’s look at some examples with interaction now to see the difference.
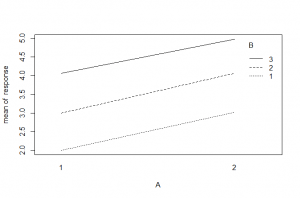
In this example, when A is at level 1, the levels of B have mean responses about 6 units apart. When A is at level 2, the mean responses at the levels of B are much more spread out. It appears the effect of B is different depending on what level of A we are at. This is the concept of interaction. The difference in means between the levels of B is different depending on what level of A we are at.
The interaction does not need to be consistent for all levels of the variables. In the example above, being at level 2 of A increased the effect of B at all levels. There could have been a decrease at all levels too. It is also possible for some combinations to have a decrease in effect and others to have an increase.
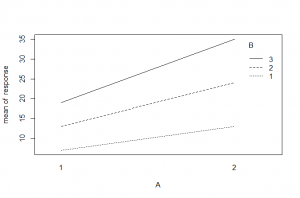
Here is one last example to visualize this. We can see that moving between A level 1 and 2 is associated with a decrease in mean response for B level 1, but an increase for B levels 2 and 3, and the increase for B level 3 is greater than the increase for level 2.
Understanding interaction is important because it modifies how we can talk about the results. For instance, in the final example above, it would be inappropriate to talk about the effect of factor A without also referring to the level of factor B. This is because the effect of factor A depends on the level of factor B due to the interaction. These plots may seem complicated, but the good news is, there is an associated test in the two-way ANOVA that allows you to test for the presence of interaction.