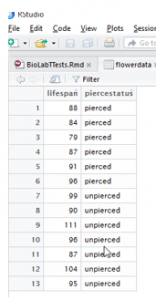
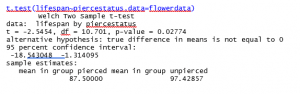
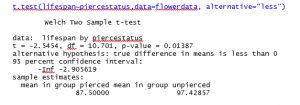
Test output may look a little bit different from different software packages. Here is the same data and test output from R, so that you can see that you would get the same values, but would need to extract them from different places in the output. Thinking about the data in this way might also make it easier to understand that there is a categorical predictor variable involved. Note that R subtracts the means in alphabetical order, so it did pierced minus unpierced, which makes the test statistic negative instead of positive (but still the same magnitude from 0). This test output was also run two-sided – look at the alternative hypothesis line. You can run one-sided test procedures too, or take statistics to learn how to get the one-sided P-value from the two-sided one. Hint: For this example, you can just divide by 2.