- Open the data set in Excel.
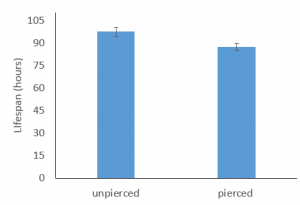
- If you have not already installed the Data Analysis ToolPak, follow the directions to install it. Then graph your data.
3. In a directional test, as we use here, first list the group for which you are expecting larger values. (This helps us get test statistics which are positive, and often easier for our minds to work with.) So, variable 1 will be the values for the group whose mean is expected to be larger, and variable 2 will be the values for the group whose mean is expected to be smaller.
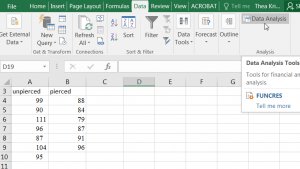
4. Select Data Analysis from the “Data” tab at the top of your window.
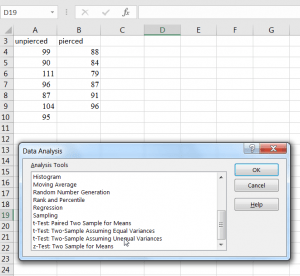
5. Select the two-sample t-test assuming unequal variances option. The option of equal variances imposes an additional condition for testing, so only select that option if you are fairly confident there are equal variances for the two groups. In short, select the unequal variances option by default.
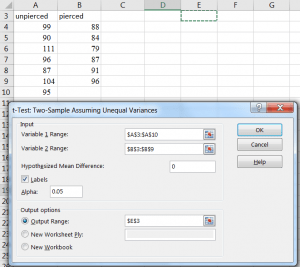
6. A new window will pop up. Click in the box beside the variable 1 range and then highlight those cells in your worksheet. Then, click in the box beside variable 2 range and highlight the appropriate cells in your worksheet. If you have included the titles, put a check in the box beside Labels. Decide where you want your output to be displayed. It is often easiest to have it go to a New Worksheet. Alternatively, you can click output range and then click in the corresponding box and highlight the cell where you want the results displayed in this worksheet. Click okay.
7. Once you click okay, you an output table will be displayed. The mean and variance of the response variable as well as the number of observations for each group are shown at the top of the table.
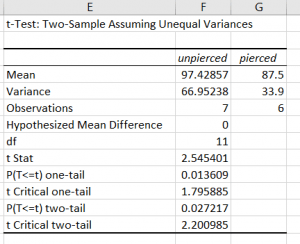
8. Now, look for the t Stat in the table. This is your t-test statistic that you will display in your results. Here, the value is 2.54. This value is the same no matter whether you are running a one-sided or two-sided test.
To attain the P-value, we need to consider whether we had a directional hypothesis. Because we were considering a directional hypothesis (we thought unpierced flowers would live longer on average), we will look at the P-value for the one-tailed test. Here that P-value is 0.014 (rounded). Recall that we set our alpha as 0.05.
So, in the text of your paper, you would say: On average, unpierced flowers had a longer life span than pierced flowers (t=2.54, P=0.014).
If you had not rejected the null hypothesis, you would have said: We do not have evidence that unpierced flowers had a longer average lifespan than pierced flowers (t, P).
If you had only hypothesized that there was a difference, without having a specific idea of the direction, you would look at the P-value for the two-tailed test. In this case, you would have a significant result with a P-value of 0.027 and a cutoff for alpha of 0.05.