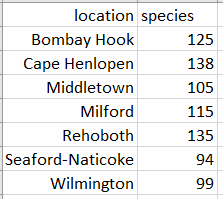
- Create a table with the data you would like to display. Write the name of the predictor variable and response variable in the first row. In this example, the predictor variable is location and the response is the count of bird species detected during the Christmas Bird Count at specific sites in Delaware (McDonald 2014).
- Highlight the entire table.
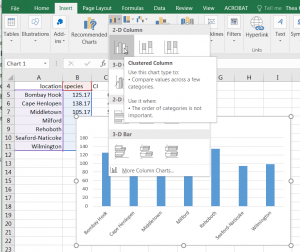
- Click on the insert tab.
- Select insert column or bar chart. Choose the first option under 2-D Column chart.
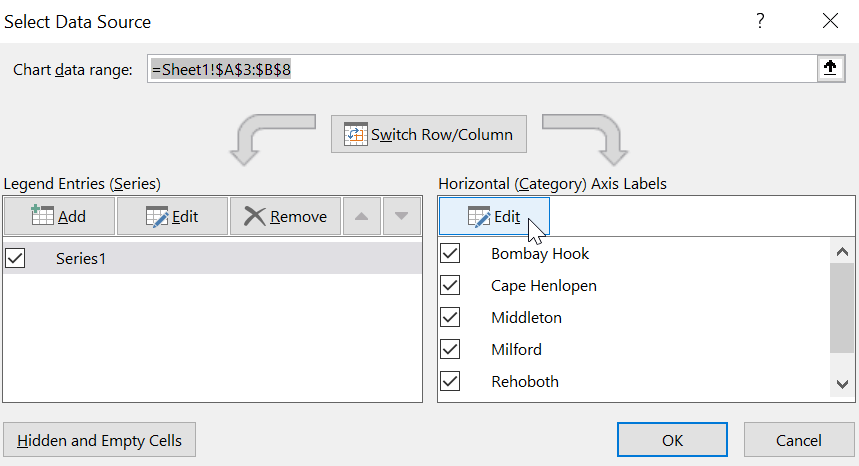
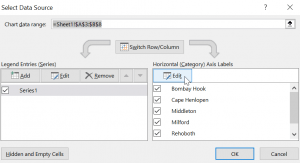
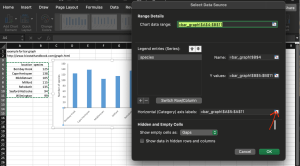
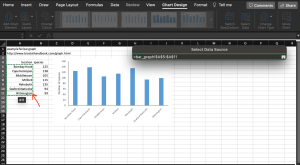
- Note that sometimes Excel will not call in the horizontal axis labels correctly. If this happens, go to the design tab and click on ‘select data’. This will then give you the option to set the labels.

- Follow formatting directions .