Variance (s2 for sample variance and σ2 for population variance) is roughly the average squared distance of each observation from the mean (Bremer and Doerge 2010). The idea is to get a sense of whether the observations are usually close to the mean or far away. The challenge when working with variance is that you obtain a value that has squared units. As a result, we usually end up working with standard deviations (described below).
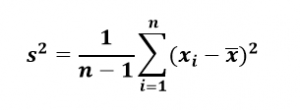
To calculate sample variance for a variable in your data set, you first consider the difference between each observation and the sample mean. Mathematically, it turns out if you just add those differences, their sum is always zero. Always getting a value of 0 doesn’t give us much information about spread. To avoid that problem, we square the difference and add this value across all observations. Finally, we divide by the sample size (n) minus 1. This scaling factor is necessary to make our sample variance the best estimate of the population variance it can be, though you may feel it more natural to divide by n. Thus, the formula for sample variance is:
We do not usually compute the sample variance by hand.
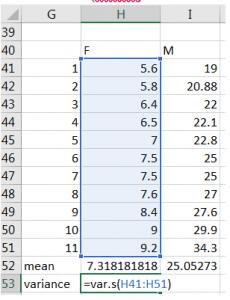
The example below continues with the example of measuring the longest claw in female fiddler crabs. We use the *VAR.S* function in Excel so that it uses the formula above for variance.
Excel
=VAR.S(cell:cell)
Data file