What we are looking for with central tendency is the center of the distribution of a variable, i.e. a typical value of the variable. In high school, you may have seen some discussion of mean, median, and mode. We are revisiting those same descriptive statistics!
Example
With respect to fiddler crabs, perhaps we are interested in the size (in mm) of the largest claw for females and males. Below is a list of measurements (mm) of the largest claw for females and males.
Female Male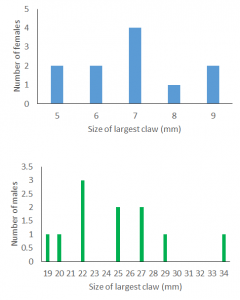
5.6 19
5.8 20.88
6.4 22
6.5 22.1
7 22.8
7.5 25
7.5 25
7.6 27
8.4 27.6
9 29.9
9.2 34.3
The graphs allow us to get a look at the shape of the distribution, but we want to be able to report and work with measures of center in order to compare the two groups. Follow the links below to explore different ways to consider the center of the data.
Explore Measures of Center:
Mean
Median
Mode
Summary of measures of center for example data set
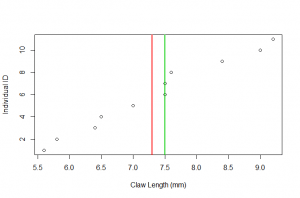
To summarize, for this variable, we computed a mean of 7.3, and a median and mode of 7.5.
Data file for measures of center